Overview
Housing price prediction is critical for buyers, sellers, lenders, and urban planners.
In this project, we developed multiple predictive models to estimate housing price per unit area in Taipei City, Taiwan.
The goal was not only to maximize prediction accuracy, but also to interpret which urban features most strongly influence real estate valuation.
Dataset
We used a publicly available dataset collected by Cheng Yeh (2018), containing:
- 414 housing transactions in Taipei City
- Response variable: price per unit area (10,000 NTD per ping)
- Key predictors:
- house age
- distance to nearest MRT station
- number of nearby convenience stores
- transaction date
- latitude / longitude
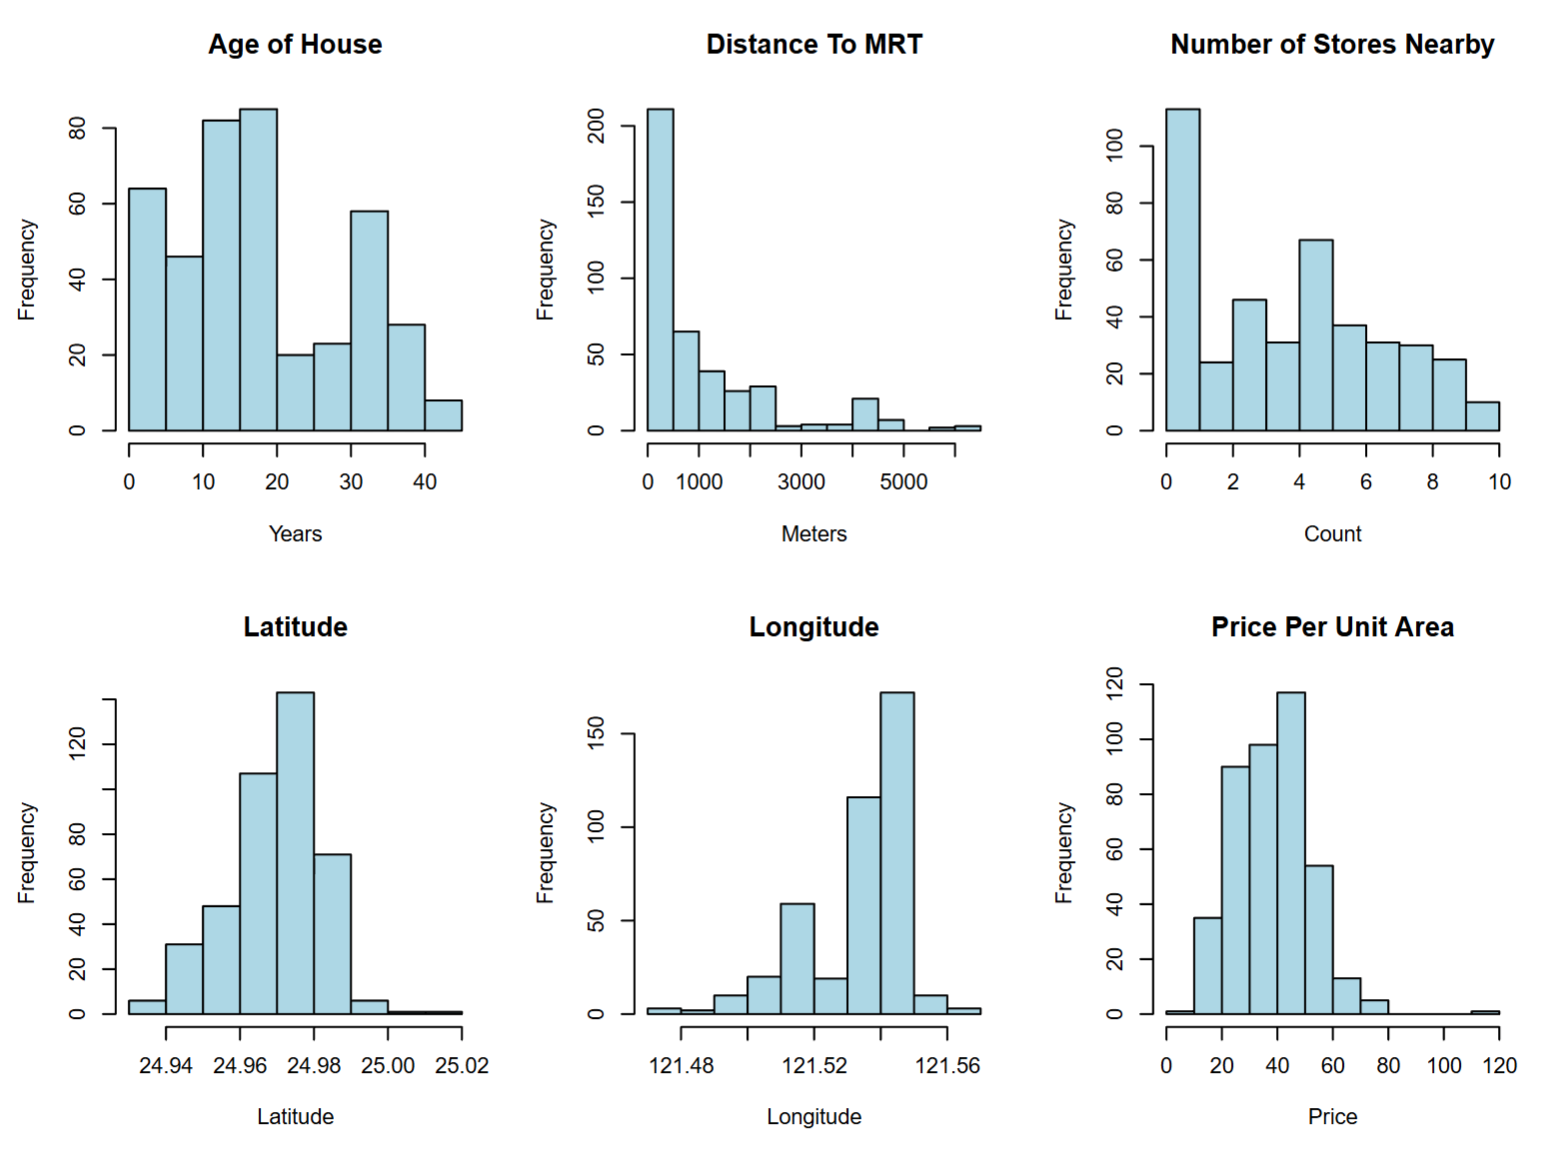
Exploratory Data Analysis (EDA)
The report includes distribution plots for all major predictors (age, MRT distance, store count, latitude/longitude, price).
Modeling Approaches
We implemented and compared four regression models:
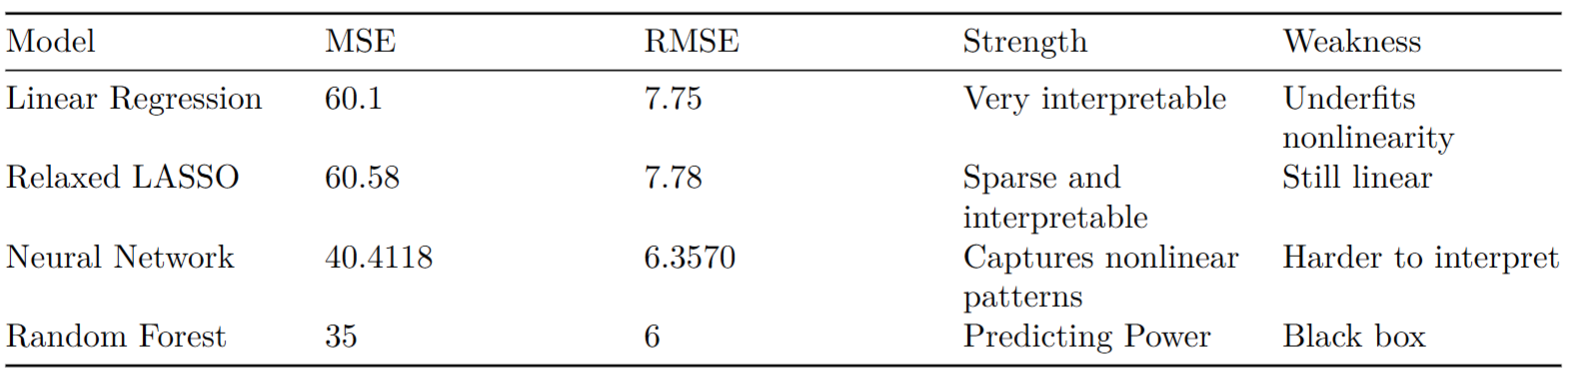
1. Baseline Linear Regression
A multiple linear regression explained ~62.5% of price variance.
- Test RMSE ≈ 7.75
2. Relaxed LASSO Regression
LASSO selected four key predictors:
- age
- distance to MRT
- store count
- latitude
Performance remained similar to baseline:
- Test RMSE ≈ 7.78
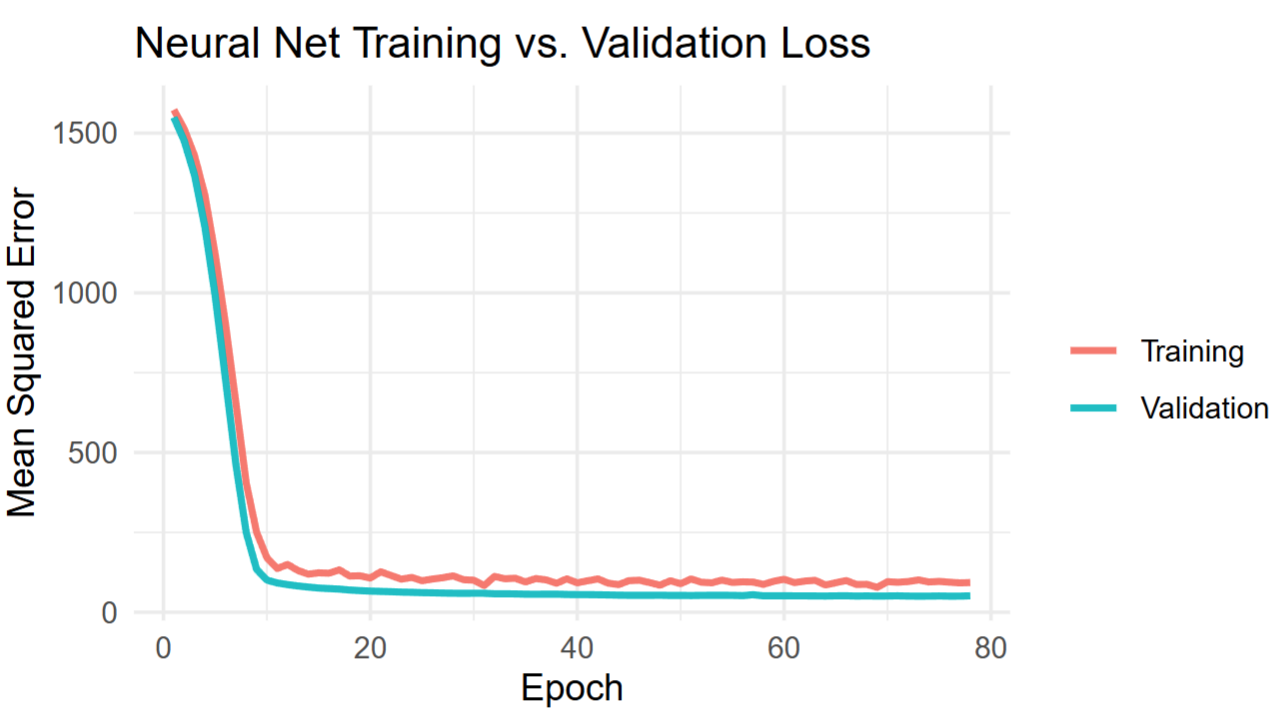
3. Neural Network (Nonlinear Model)
To capture nonlinear interactions, we trained a feedforward neural network:
- two hidden layers (64 → 32 units)
- dropout + early stopping
This improved prediction accuracy substantially:
- Test RMSE ≈ 6.36
- ~20% reduction in error compared to linear models
4. Random Forest (Best Model)
A tuned random forest achieved the strongest predictive performance:
- Test RMSE ≈ 5.83 (best overall)
Key Findings
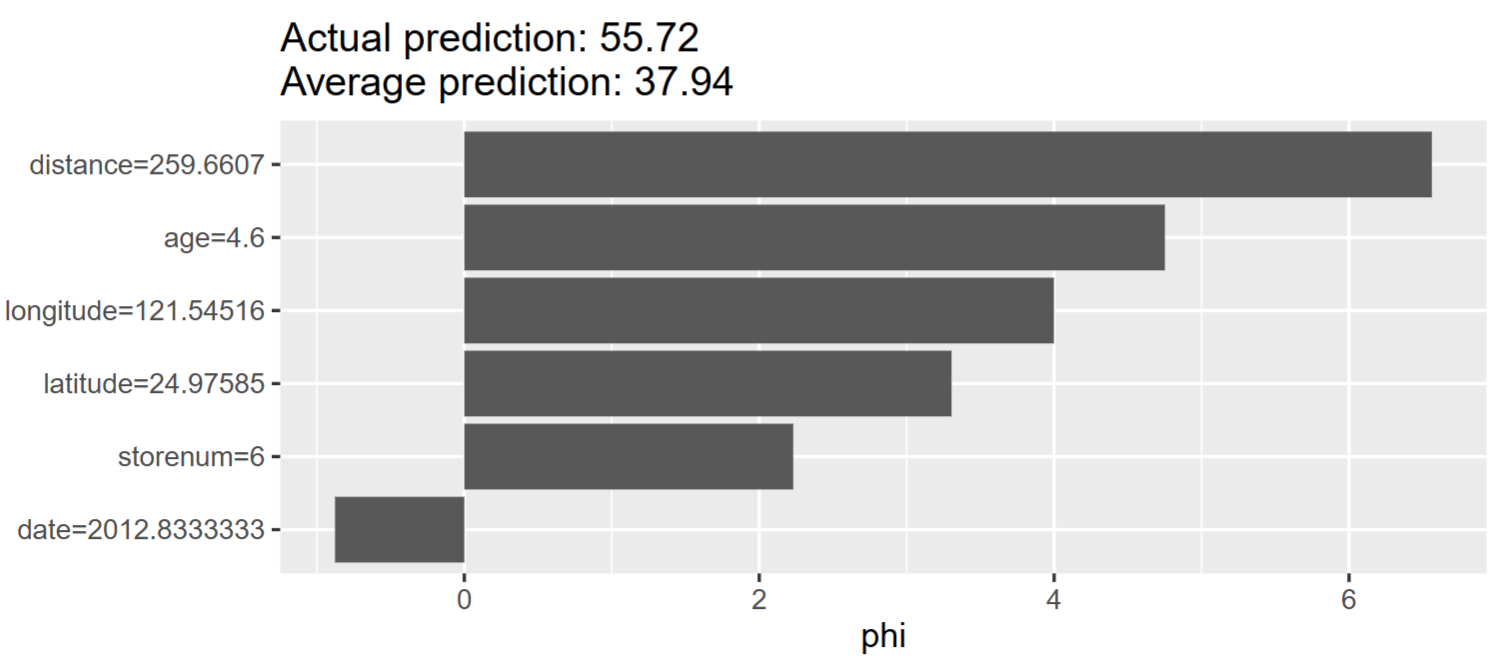
Across all nonlinear models, the most important driver of housing price was:
Distance to MRT station (dominant factor)
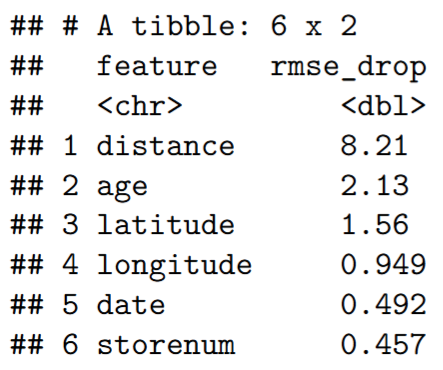
Both neural network permutation importance and random forest feature rankings consistently placed MRT proximity as the strongest predictor.
Other influential features included:
- house age
- latitude
- transaction timing
Discussion
This project demonstrates that housing prices in Taipei are shaped primarily by transport accessibility and spatial structure, rather than only property-level attributes.
Why Nonlinear Models Outperformed Linear Regression
Baseline linear regression achieved an RMSE of ~7.75, explaining about 62.5% of price variance. However, both neural networks and random forests significantly improved performance:
- Neural Network RMSE ≈ 6.36
- Random Forest RMSE ≈ 5.83 (best)
This suggests nonlinear interactions play an important role in real-world housing valuation.
MRT Proximity as the Dominant Driver
Across both permutation importance (neural network) and feature importance rankings (random forest), the most influential factor was consistently:
Distance to the nearest MRT station
This aligns with Taipei’s metro-centered urban structure, where transit accessibility strongly drives neighborhood desirability.
Practical Implications
The results suggest housing valuation models should emphasize:
- transit-oriented development factors
- spatial location features
- nonlinear modeling techniques for pricing systems
Such predictive frameworks can support:
- buyers and sellers in pricing decisions
- lenders in risk evaluation
- policymakers in infrastructure planning
Conclusion
We successfully built a comparative regression pipeline for Taipei housing price prediction, evaluating:
- Linear Regression
- Relaxed LASSO
- Neural Networks
- Random Forests
The tuned random forest achieved the strongest performance:
- Test RMSE ≈ 5.83, reducing error to ~15% of mean housing price
Most importantly, we identified MRT accessibility as the key structural driver of real estate valuation in Taipei.
Limitations & Future Work
Despite strong predictive results, limitations remain:
- The dataset contains only 6 predictors, missing socioeconomic and neighborhood-level variables
- Results may not generalize beyond Taipei or beyond the sampled time period
- Future work could incorporate richer geospatial modeling and larger transaction datasets
Potential extensions include:
- incorporating income, school quality, zoning indicators
- applying gradient boosting or spatial regression models
- scaling to broader housing markets
Cover Image Credit: me, bewildered about where to go next on the snow trail